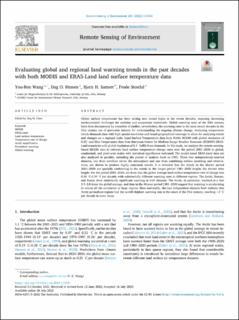
Evaluating global and regional land warming trends in the past decades with both MODIS and ERA5-Land land surface temperature data
| dc.contributor.author | Wang, You-Ren | |
| dc.contributor.author | Hessen, Dag | |
| dc.contributor.author | Samset, Bjørn Hallvard | |
| dc.contributor.author | Stordal, Frode | |
| dc.date.accessioned | 2024-02-15T13:43:51Z | |
| dc.date.available | 2024-02-15T13:43:51Z | |
| dc.date.created | 2022-07-29T05:00:34Z | |
| dc.date.issued | 2022 | |
| dc.identifier.issn | 0034-4257 | |
| dc.identifier.uri | https://hdl.handle.net/11250/3118013 | |
| dc.description.abstract | Global surface temperature has been setting new record highs in the recent decades, imposing increasing environmental challenges for societies and ecosystems worldwide. Global warming rates of the 20th century have been documented by a number of studies, nevertheless, the warming rates in the most recent decades in the 21st century are of particular interest for understanding the ongoing climate change. Analyzing temperature trends demands data with high spatial resolution and broad geographical coverage to allow for analyzing trends and changes on a regional scale. Land Surface Temperature data from NASA MODIS with global resolution of 0.05° and Skin Temperature data from European Centre for Medium-Range Weather Forecasts (ECMWF) ERA5-Land reanalysis with global resolution of 0.1° fulfill these demands. In this study, we analyze the remote-sensing-based MODIS data to estimate land surface temperature change rates over the period 2001–2020 in global, continental, and pixel-wise scales with statistical significance indicated. The model-based ERA5-Land data are also analyzed in parallel, extending the period of analysis back to 1981. These two independently-sourced datasets, one from satellites above the atmosphere and one from combining surface modeling and observations, are shown to produce highly consistent results. It is revealed that the trends in the shorter period 2001–2020 are spatially conforming to the trends in the longer period 1981–2020 despite the shorter time length. For the period 2001–2020, we show that the global average land surface temperature rate of change was 0.26 °C-0.34 °C per decade, with substantially different warming rates in different regions. The Arctic, Europe, and Russia show statistically significant warming in both datasets. The Arctic, in particular, warmed at a rate 2.5–2.8 times the global average, and data in the 40-year period 1981–2020 suggest that warming is accelerating in almost all the continents or large regions. Most noticeably, the two independent datasets both indicate that Arctic permafrost regions had the world's highest warming rate at the onset of the 21st century, reaching >2 °C per decade in some areas. | en_US |
| dc.language.iso | eng | en_US |
| dc.publisher | Elsevier | en_US |
| dc.rights | Navngivelse 4.0 Internasjonal | * |
| dc.rights.uri | http://creativecommons.org/licenses/by/4.0/deed.no | * |
| dc.title | Evaluating global and regional land warming trends in the past decades with both MODIS and ERA5-Land land surface temperature data | en_US |
| dc.title.alternative | Evaluating global and regional land warming trends in the past decades with both MODIS and ERA5-Land land surface temperature data | en_US |
| dc.type | Peer reviewed | en_US |
| dc.type | Journal article | en_US |
| dc.description.version | publishedVersion | en_US |
| dc.source.volume | 280 | en_US |
| dc.source.journal | Remote Sensing of Environment | en_US |
| dc.identifier.doi | 10.1016/j.rse.2022.113181 | |
| dc.identifier.cristin | 2040033 | |
| dc.relation.project | Norges forskningsråd: 294948 | en_US |
| dc.relation.project | Norges forskningsråd: 310648 | en_US |
| dc.relation.project | Universitetet i Oslo: 103920 | en_US |
| cristin.ispublished | true | |
| cristin.fulltext | original | |
| cristin.qualitycode | 2 |
Tilhørende fil(er)
Denne innførselen finnes i følgende samling(er)
-
Journal articles [478]

Med mindre annet er angitt, så er denne innførselen lisensiert som Navngivelse 4.0 Internasjonal