Modeling Global Carbon Costs of Plant Nitrogen and Phosphorus Acquisition
| dc.contributor.author | Braghiere, R.K. | |
| dc.contributor.author | Fisher, J.B. | |
| dc.contributor.author | Allen, K. | |
| dc.contributor.author | Brzostek, E. | |
| dc.contributor.author | Shi, M. | |
| dc.contributor.author | Yang, X. | |
| dc.contributor.author | Ricciuto, D.M. | |
| dc.contributor.author | Fisher, Rosie | |
| dc.contributor.author | Zhu, Q. | |
| dc.contributor.author | Phillips, R.P. | |
| dc.date.accessioned | 2024-02-06T11:18:49Z | |
| dc.date.available | 2024-02-06T11:18:49Z | |
| dc.date.created | 2022-09-08T12:18:11Z | |
| dc.date.issued | 2022 | |
| dc.identifier.citation | Journal of Advances in Modeling Earth Systems. 2022, 14 (8), . | en_US |
| dc.identifier.issn | 1942-2466 | |
| dc.identifier.uri | https://hdl.handle.net/11250/3115871 | |
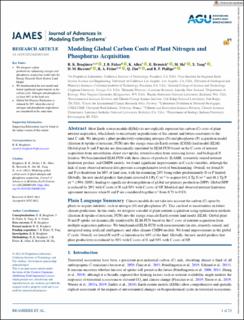
| dc.description.abstract | Most Earth system models (ESMs) do not explicitly represent the carbon (C) costs of plant nutrient acquisition, which leads to uncertainty in predictions of the current and future constraints to the land C sink. We integrate a plant productivity-optimizing nitrogen (N) and phosphorus (P) acquisition model (fixation & uptake of nutrients, FUN) into the energy exascale Earth system (E3SM) land model (ELM). Global plant N and P uptake are dynamically simulated by ELM-FUN based on the C costs of nutrient acquisition from mycorrhizae, direct root uptake, retranslocation from senescing leaves, and biological N fixation. We benchmarked ELM-FUN with three classes of products: ILAMB, a remotely sensed nutrient limitation product, and CMIP6 models; we found significant improvements in C cycle variables, although the lack of more observed nutrient data prevents a comprehensive level of benchmarking. Overall, we found N and P co-limitation for 80% of land area, with the remaining 20% being either predominantly N or P limited. Globally, the new model predicts that plants invested 4.1 Pg C yr−1 to acquire 841.8 Tg N yr−1 and 48.1 Tg P yr−1 (1994–2005), leading to significant downregulation of global net primary production (NPP). Global NPP is reduced by 20% with C costs of N and 50% with C costs of NP. Modeled and observed nutrient limitation agreement increases when N and P are considered together (r2 from 0.73 to 0.83). | en_US |
| dc.language.iso | eng | en_US |
| dc.rights | Navngivelse 4.0 Internasjonal | * |
| dc.rights.uri | http://creativecommons.org/licenses/by/4.0/deed.no | * |
| dc.title | Modeling Global Carbon Costs of Plant Nitrogen and Phosphorus Acquisition | en_US |
| dc.title.alternative | Modeling Global Carbon Costs of Plant Nitrogen and Phosphorus Acquisition | en_US |
| dc.type | Peer reviewed | en_US |
| dc.type | Journal article | en_US |
| dc.description.version | publishedVersion | en_US |
| dc.source.pagenumber | 0 | en_US |
| dc.source.volume | 14 | en_US |
| dc.source.journal | Journal of Advances in Modeling Earth Systems | en_US |
| dc.source.issue | 8 | en_US |
| dc.identifier.doi | 10.1029/2022MS003204 | |
| dc.identifier.cristin | 2049885 | |
| cristin.ispublished | true | |
| cristin.fulltext | original | |
| cristin.qualitycode | 1 |
Tilhørende fil(er)
Denne innførselen finnes i følgende samling(er)
-
Journal articles [468]

Med mindre annet er angitt, så er denne innførselen lisensiert som Navngivelse 4.0 Internasjonal